Direct current measurements - require time and space averaging and/or filtering to remove unwanted signals such as those from tides and internal waves. The remaining signal still contains all of the time scales of the large-scale circulation. It is more or less the case that long time scales go with large horizontal spatial scales. There is no hard and fast rule about how long the time average must be that corresponds with a velocity estimate associated with the pressure gradient. (current meter results, float trajectories and averages - see aquarium lecture .)
Pressure gradients can be used to calculate geostrophic flows. Pressure can be measured in several ways. Altimetry provides the sea surface height to within several centimeters, which is not adequate for the "mean" circulation, but is adequate for determining the variability of the surface currents about an unknown mean. Pressure gauges on the ocean bottom can be calibrated with direct current measurements (say from current meters), and then used in pairs to calculate geostrophic flow. As with direct current measurements, time series signals must be averaged or filtered.
Finally, pressure gradients can be determined from dynamic height (density field), again to within an unknown pressure at each position (next subsection). The unknown can be thought of as due to the unknown exact sea surface height relative to the geoid (and which altimetry is mainly not quite adequate to measure).
Velocities associated with the general circulation are then mostly calculated from the pressure gradients, with a number of techniques used to estimate the absolute pressure at each point and hence the absolute velocity.
1.2 Dynamic height. To calculate pressure at a point relative to a deeper or shallower point at the same horizontal location, from the measured density field.
Use hydrostatic balance, which is the force balance between the vertical pressure gradient and gravity*density.
The practical details of the calculation are beyond the scope of these notes and class, but an example is worked through in class. (Figure in class: dynamic height at the sea surface relative to a deeper pressure for the Pacific, from Wyrtki [1971], and adjusted steric height for the Pacific, from Reid [1997].)
1.3 Transports. We often wish to express how much total water or heat or salt or carbon is moving around. Transports are the total flux of whatever property through a given area. The general expression for transports is the integral over the area of the property*velocity.
Volume transport: integral of velocity over the area. Units are m^3/sec. A typical transport for a major current is on the order of 10 to 100 x 10^6 m^3/sec. We use the unit "Sverdrup" where 1 Sv = 1 x 10^6 m^3/sec.
Mass transport: integral of density*velocity over the area. Units are kg/sec. A typical transport for a major current is order 10 to 100 x 10^9 kg/sec (since density is roughly 1000 kg/m^3).
Heat transport: integral of heat*velocity over the area. Units are Watts (e.g. Joules/sec). Heat must be calculated using Kelvin degrees. Heat transport through a closed area, through which there is no net mass transport, is basically proportional to the temperature difference between water entering and water leaving across the closed boundaries, so degrees Celsius are fine for this practical use. Net heat transport across various latitude lines which close at boundaries range from -1.0 to 1.0 x 10^15 Watts. We sometimes use the unit 1 Petawatt = 1 x 10^15 Watts.
Freshwater transport: Salt in the ocean is not gained or lost over the time scales of interest to us. However freshwater is exchanged with the atmosphere and land. A kilogram of seawater consists of a portion of water and a portion of salt. The relative proportions are expressed in the salinity, which is taken for these transport calculations to be (gm salt/kg seawater) or (gm salt/(kg salt + kg freshwater)). Using the salinity measured along a section, we can calculate the freshwater transport across the section. Typical values are order 1 Sv.
Other substance transports (carbon, oxygen, etc etc). If the property is given as a concentration ( gm property/gm seawater), then the transport is integral(concentration*density*velocity) over the area, which yields gm/sec of the substance.
(Figure in class: mass transports in the North Atlantic from Schmitz and McCartney; heat transports for the globe from various sources.)
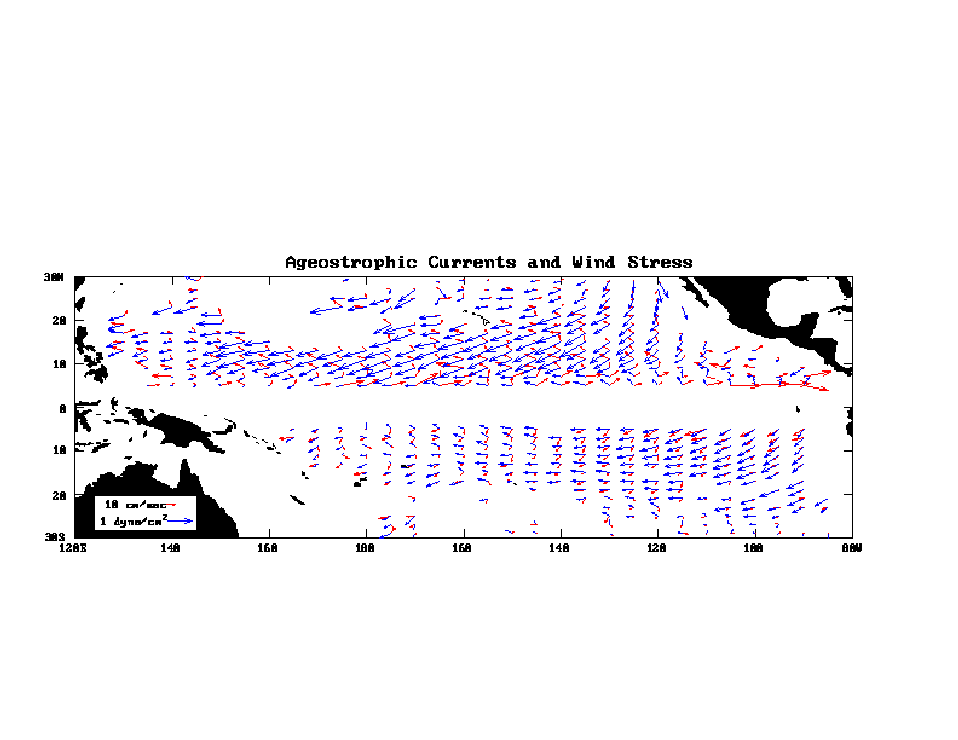
2.a. Wind forcing. As described in full in Hendershott's lectures, the wind acts directly and frictionally on the surface 50 to 100 meters of the ocean, in the "Ekman layer". The net transport in the Ekman layer is to the right of the wind in the northern hemisphere and to the left in the southern hemisphere. This effect has been demonstrated by Ralph and Niiler (1997) using surface drifter data from the the Pacific (drogues at 15 m).
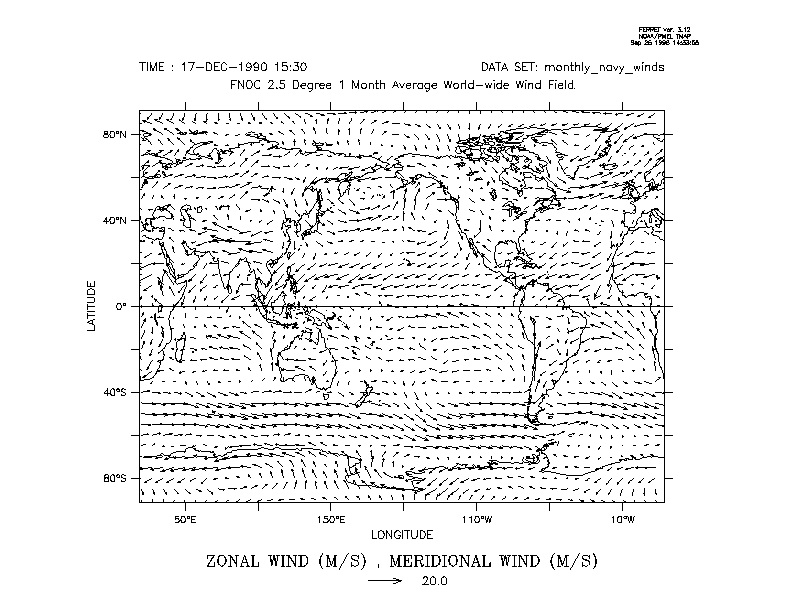
Westerlies and trades (see example or Hellerman and Rosenstein [1983] figures in lecture handout or other wind products)
For a more complete and general description of how the wind drives the
general circulation, see section 5 in
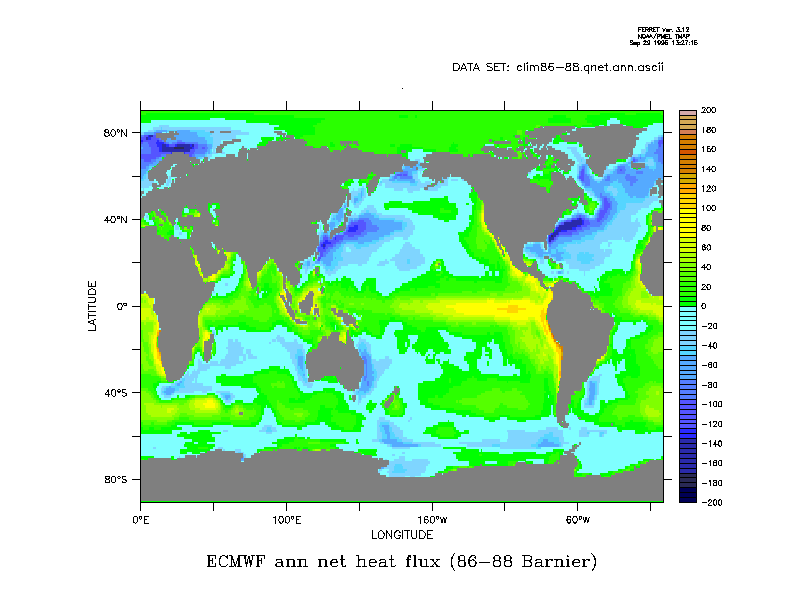
2.b. Thermohaline forcing. The gross aspects of the salinity and temperature distributions, and the driving force for the slow overturning circulation, are due to surface heating/cooling and surface evaporation/precipitation/ continental runoff. Maps of heat flux and evaporation - precipitation are presented. Components of the heat flux are described (incoming shortwave solar radiation, outgoing longwave radiation, latent heat loss due to evaporation, sensible heat change due to conduction between air and water). Input of fresh water takes place through precipitation and runoff from land. I don't have a net buoyancy flux map for the lecture notes.
Thermohaline forcing takes several forms.
(1) cooling/evaporation
in a region (cooling is often due to
large evaporation), which creates dense water at the sea
surface which then overturns in convective cells. These
cells are very narrow (order 1 km), and are referred to sometimes
as "chimneys", or a whole patch of convective cells might
be referred to as a chimney. Flow in the convective cells
is "ageostrophic" - that is, not geostrophic, since vertical
velocities and vertical length scales are of the same order
as in the horizontal.
(2) Brine rejection resulting
from sea ice formation. This releases salt into the water
column, which increases its density and can create overturn.
(3) Any downward flow due to increase of density must
be compensated somewhere by upwelling and inflow into the
overturning regions. The upwelling must be accompanied
by vertical mixing as the water parcels migrate upward.
This upwelling is an essential part of the thermohaline
circulation and is what forces most of the flow which we
call "thermohaline".
(4) Salt and temperature do not actually mix at exactly the
same rates, especially at the molecular scale - temperature mixes
much faster. This difference in mixing rates can create layering
or overturn - in the ocean, on vertical scales of several to 10's
of meters. This is a form of thermohaline forcing.
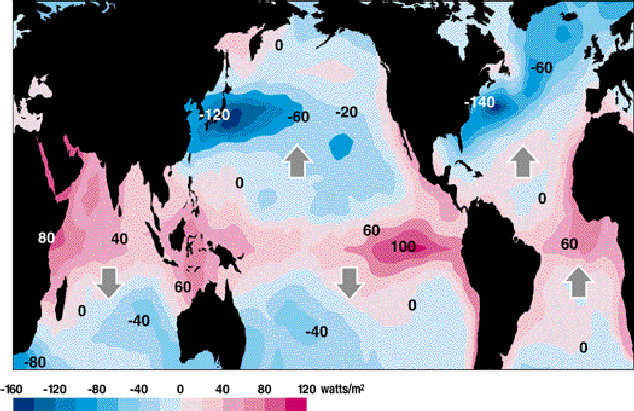
Annual mean net heat flux (W/m2)
I have superimposed on the map the directions of meridional heat
transport at selected subtropical latitudes, based on direct
oceanic measurements.
Barnier, B., L. Siefridt and P. Marchesiello, 1994. Thermal forcing for a global ocean circulation model using a three- year climatology of ECMWF analyses. J. Marine Systems, 6, 363-380.
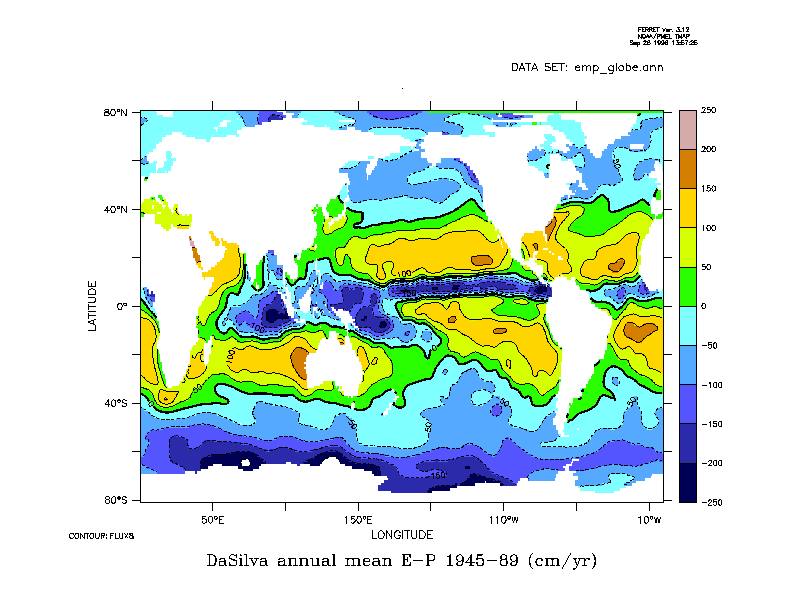
Annual mean net evaporation minus precipitation (cm/yr)
Annual mean E-P
in cm/year constructed
from climatology data in DaSilva's online
Atlas of Surface Marine Data.
DaSilva, A. M., C. C. Young and S. Levitus, 1994. Atlas of surface
marine data 1994.