SIO 221C: Color Maps and Images
Images: The Matlab image
functions order arrays like mathematical matrices with
coordinate (1,1) in the upper left corner. Data tend to start
with the smallest latitude and longitude values, which should be mapped
in the lower left corner. To make your Matlab image plot look
correct, you can use axis xy,
or you can flip the matrix top-to-bottom: imagesc(lon_t,lat_t,flipud(T));
Colormaps: In Matlab,
the default colormap for contour and image plots is a blue
to red spectrum, but you can override this. To change the
colormap used for contour or image plots, you can specify a different
basic color map by typing, for example, colormap(cool). Other
colormaps include hsv, prism, gray, hot, cool, copper, flag, pink,
bone, and jet (the default).
Sometimes, you want to make sure that NaNs don't end up shaded the same
color as useful data points, so you can force values at the end of your
range to be white or black, for example.
cmap2=[[1
1 1]; colormap; [1 1
1]];
colormap(cmap2);
You might have to fix the limits of your colors to keep real data from
also being whited out. To get black where you had no data, you'd
use [0 0 0].
Colormaps and color blindness:
About 8% of men and 0.5% of women have color-impaired vision.
Often this means that red and green are difficult to distinguish, which
means that the Matlab default 'jet' colormap can be difficult to
interpret. Some Chinese post-docs have pointed out that in China
students are tested for color vision limitions before being permitted to
enroll in undergraduate study in oceanography or other graphically
intensive fields. In the US (and Europe) students have broader choices,
and it is traditional to attempt a more inclusive approach, by making
graphics accessible to everyone.
Rather than the 'jet' colormap, better choices are single color schemes (such as
Matlab's 'hot') that increase in intensity, or diverging schemes that
extend from blue to red. For a reprint of a 2004 EOS article,
comments, and reply see: http://geography.uoregon.edu/datagraphics/EOS/index.htm
For general information
see:
http://geography.uoregon.edu/datagraphics/index.htm
or for tools to check your graphics:
http://www.vischeck.com/vischeck/
Ruth Musgrave passed on some scripts
that she has to do red/blue divergent colormaps:
redblue.m, redblue2.m,
redblue4.m. Ruth says that Jonathan Nash (Oregon
State University) passed these on to her, but we don't know their origins.
Veronica Tamsitt has identified some useful Matlab scripts for creating custom
colormaps with divergent colormaps using any two colors a colormap
with a single color of increasing intensity.
The function cmap creates custom colormaps from light to dark shades of 1 or more colors. Veronica says she used this to make a blue to
red colormap:
colormap([cmap('DarkBlue',50,10,0);flipud(cmap('red',50,10,0))]);
Another useful tool mentioned by Veronica is the rgb function, which allows you to call colors by name and returns the rgb triple.
November 2014: There's further discussion on this topic in the form
of an open letter to the climate science community by Ed Hawkins et al. who urge all
os to sign a pledge "to never again be an author on a paper which [sic] uses
a rainbow colour scale." The open
letter draws attention to a recent BAMS article and to
new Matlab changes in default color scales.
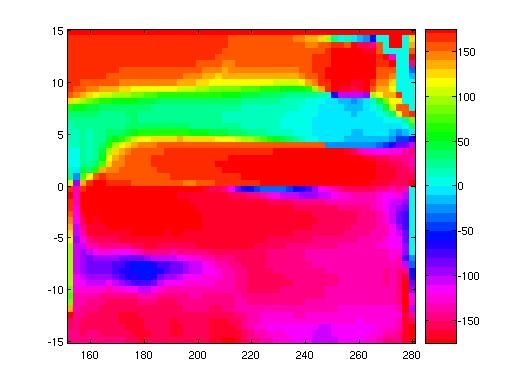
Colormaps and the branch cut:
We can also compute the angular direction of the current and plot that
as an image:
theta=atan2(V,U)*180/(pi);
Here we use atan2 rather than atan, because we want our angles
to go from 0 to 360 degrees.
Since 0 and 360 degrees are equivalent, it's good to choose a
colorscale where the colors are 0 and 360 are nearly the same.
The clrscl.m function (written by Matt Dzieciuch of IGPP)
provides one way to fix a colorscale
appropriately. Compare:
imagesc(lon_t,lat_t,theta);
axis xy; colorbar
with
colormap(clrscl('rmbcgyr',36))
imagesc(lon_t,lat_t,theta); axis
xy; colorbar
Andrew Delman points out that the Matlab hsv colormap also provides the desired wrap around
colorscale. This has the virtue that hue and saturation can be controlled separately,
so saturation can be used to illustrate uncertainties (with low-confidence values nearly
white, and high-confidence values fully saturated with strong colors.)