Validation of the AMSR-E Sea Surface Temperature in the Southern
Ocean
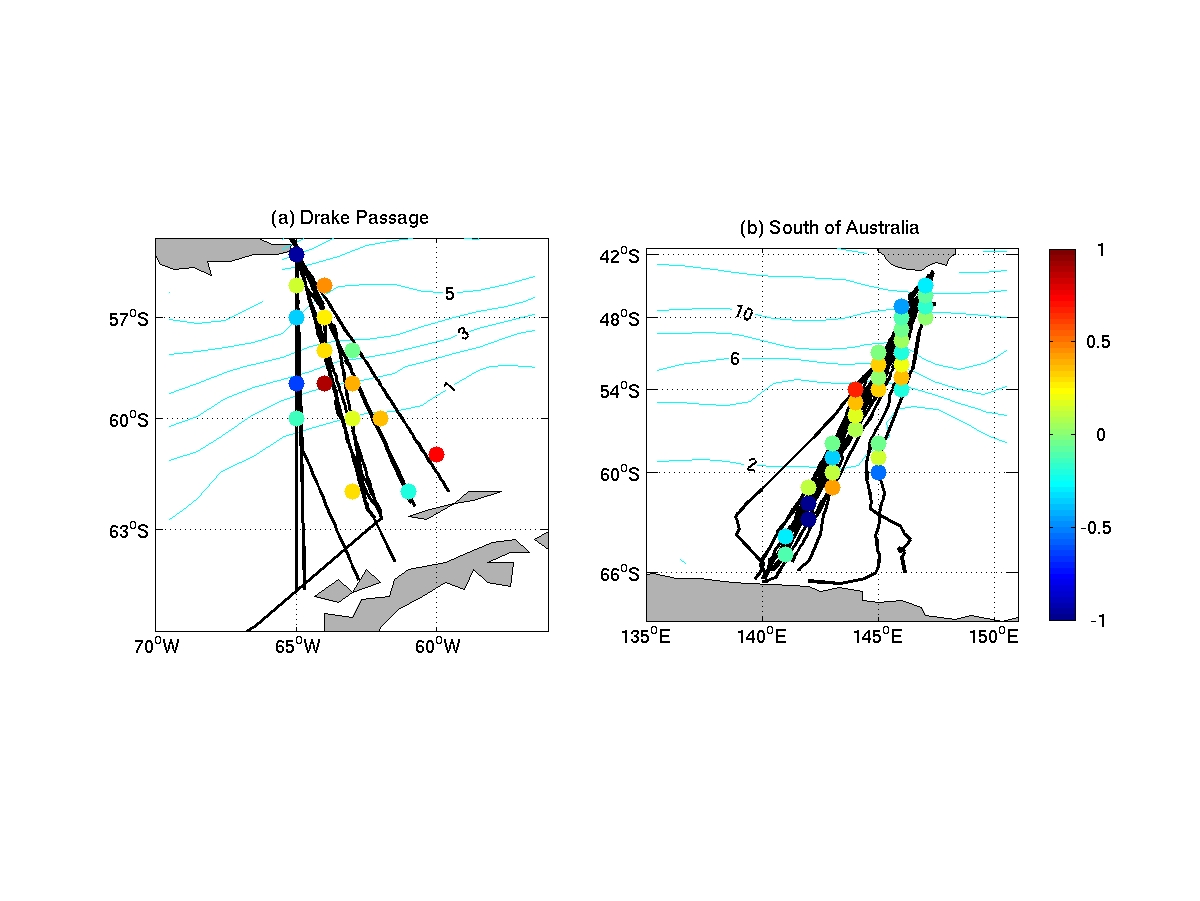
Figure 1
.
Repeat
XBT and TSG lines (black) collected in the Southern Ocean between
June 2002 and February 2004 for (a) Drake Passage transects and (b)
Hobart to Dumont d'Urville transects. The colored dots indicate the
mean temperature difference between AMSR-E and XBT at different
locations. The color scale is from -1°C
(dark blue) to 1°C
(red) but actual temperature differences may exceed 1°C
in places.
Contours indicate mean temperatures.
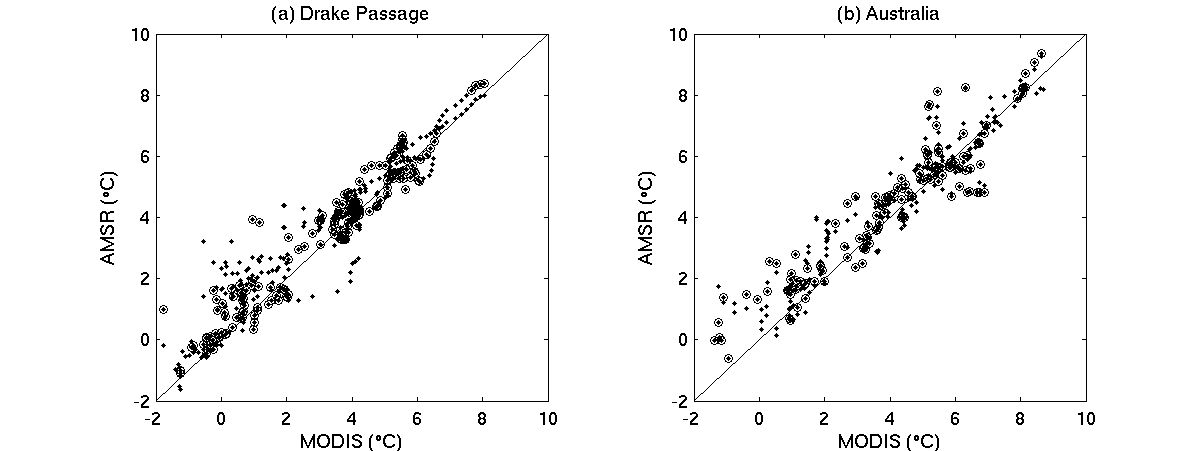
Figure 2
.
Scatter
plots of sea surface temperature from MODIS against that from AMSR-E
(dot) for (a) Drake Passage transects, and (b) transects between
Hobart and Dumont
d'Urville. Circles
indicate these data within 5 hours of in situ
XBT observations.
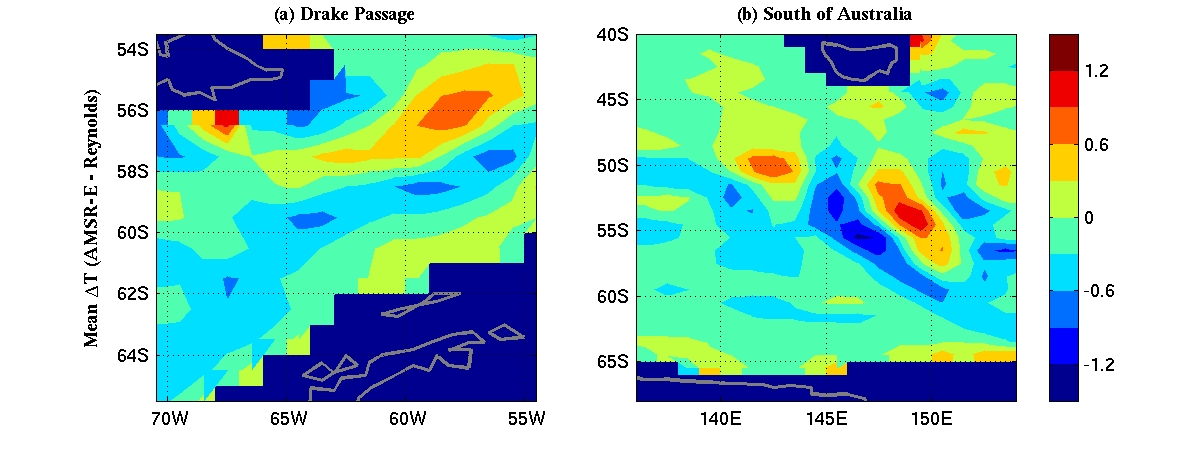
Figure 3
.
Spatial
distribution of the temporal mean temperature difference (two-year
average) between AMSR-E and Reynolds OI SST in the region of (a)
Drake Passage and (b) south of Australia.
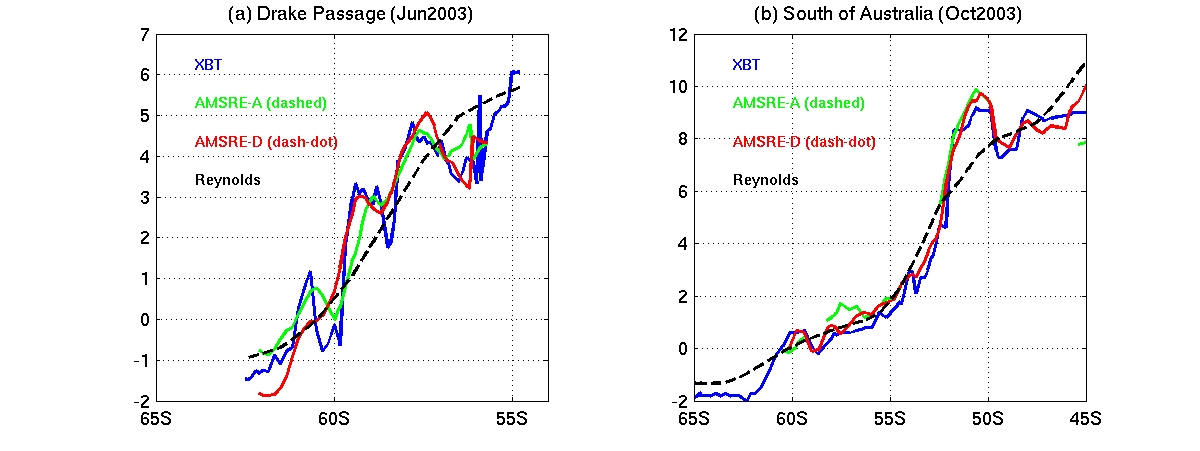
Figure 4
.
Examples
of the sea surface temperature (a) across Drake Passage and (b)
between Hobart and Dumont d'Urville as a function of latitude. The
four different SSTs are from XBT (blue), ascending
AMSR-E (green),
descending AMSR-E (red), and Reynolds (black), respectively.
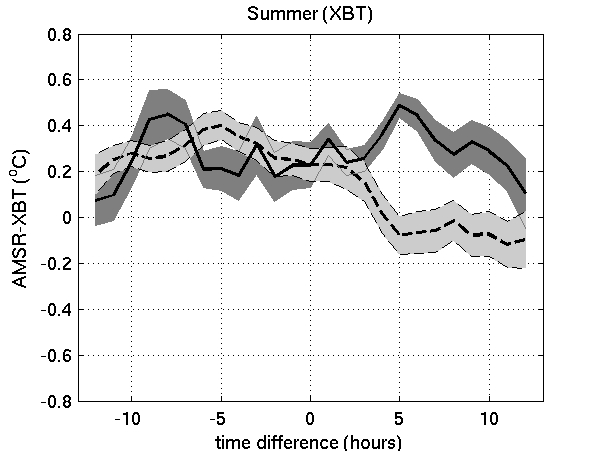
Figure 6
.
Changes
of temperature difference with increasing time separation for Drake
Passage transects. The lines (daytime – solid, nighttime –
dashed) indicate the temperature difference and the shading area
shows the standard error.
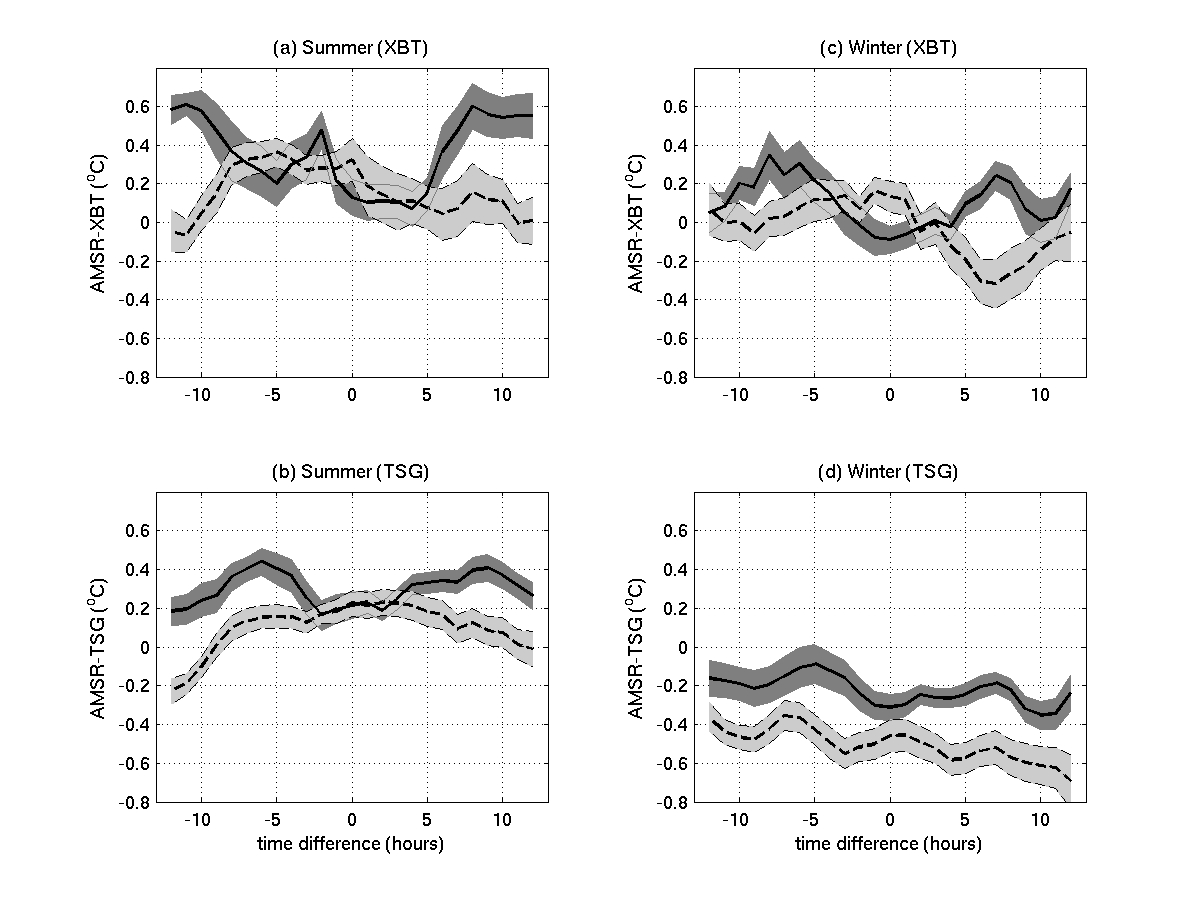
Figure 7
.
Same
as Fig.6 but for summertime
transects between
Hobart and Dumont d'Urville.
Figure 8
.
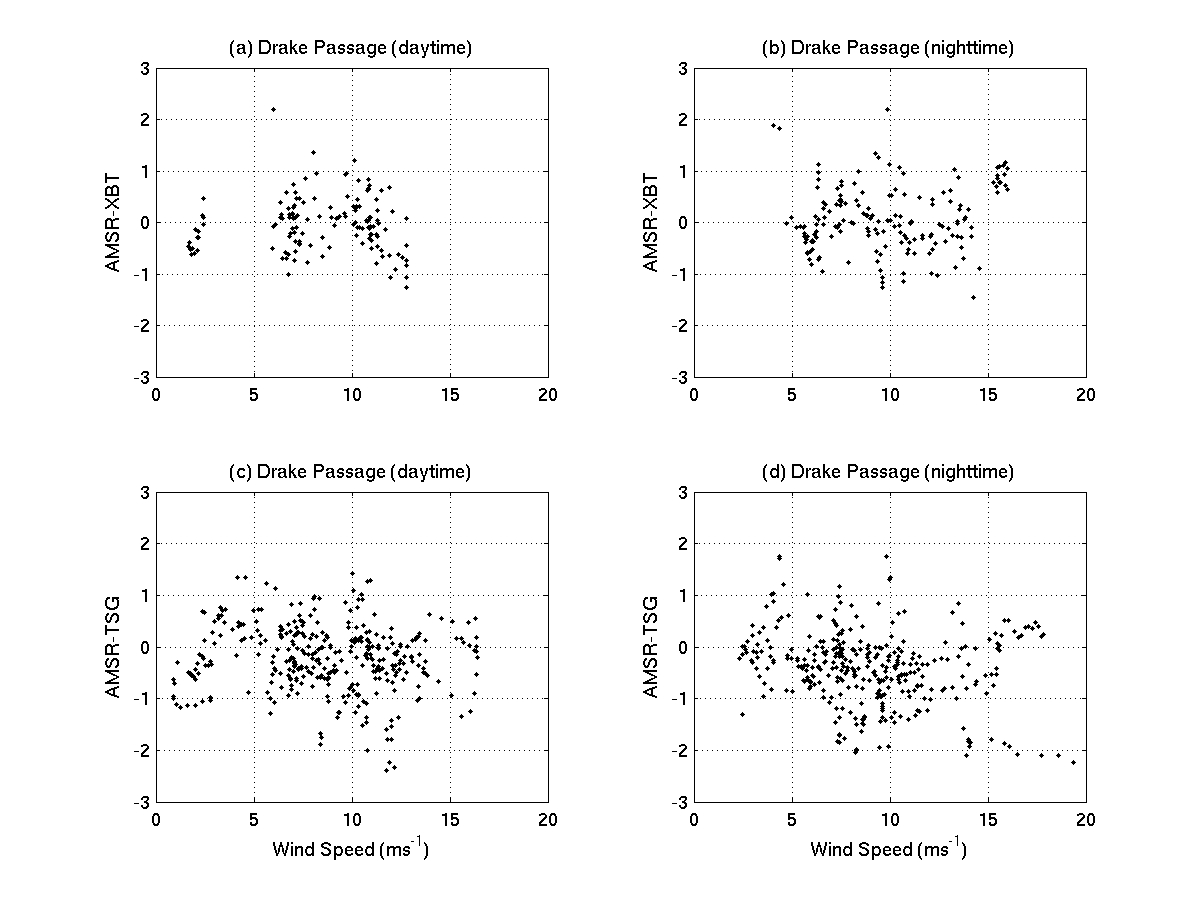
Scatter
plots of temperature difference against wind speed during summer for
(a) ascending AMSR-E minus XBT and (b) descending AMSR-E minus XBT
across Drake Passage, (c)
Ascending AMSR-E minus TSG and (d) descending AMSR-E minus TSG across
Drake Passage. (e) and (f) are similar to (a) and (b) but for the
transects between Hobart
and Dumont d'Urville.
Figure 9
.
Similar
to Fig.8, but for wintertime. No wintertime in situ
SST observations are available for the transects between
Hobart and Dumont d'Urville.
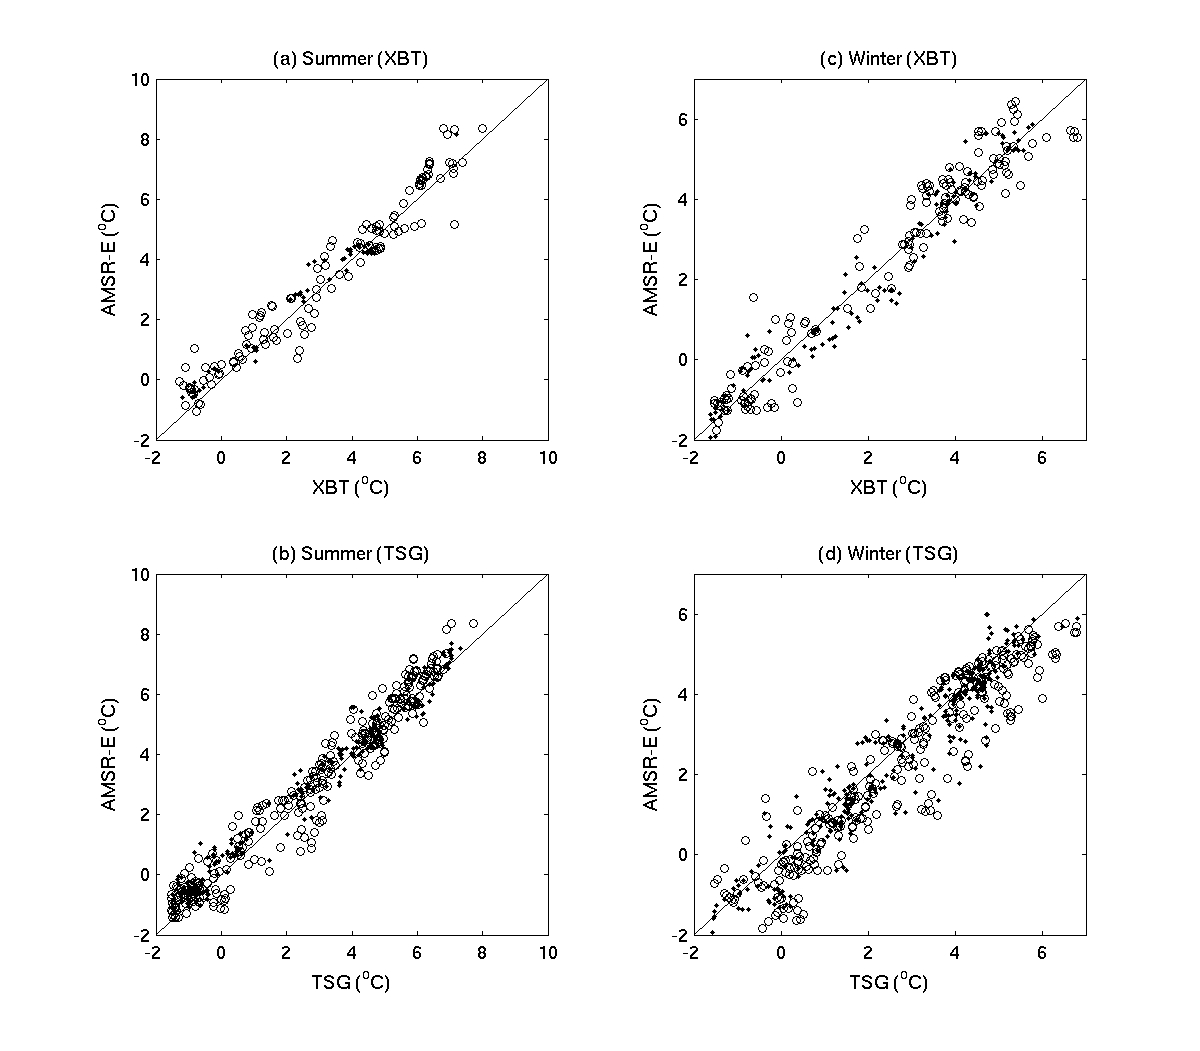
Figure 10
.
Scatter
plots of sea surface temperature from XBT/TSG (x-axis) against that
from ascending AMSR-E (dot) and descending AMSR-E (circle) for summer
(left panels) and winter (right panels), respectively, for Drake
Passage transects.
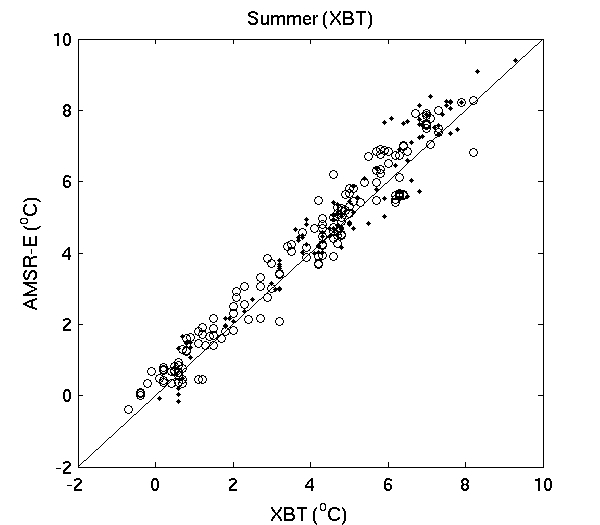
Figure 11
.
Same
as Fig.10 but for summertime transects between
Hobart and Dumont d'Urville.
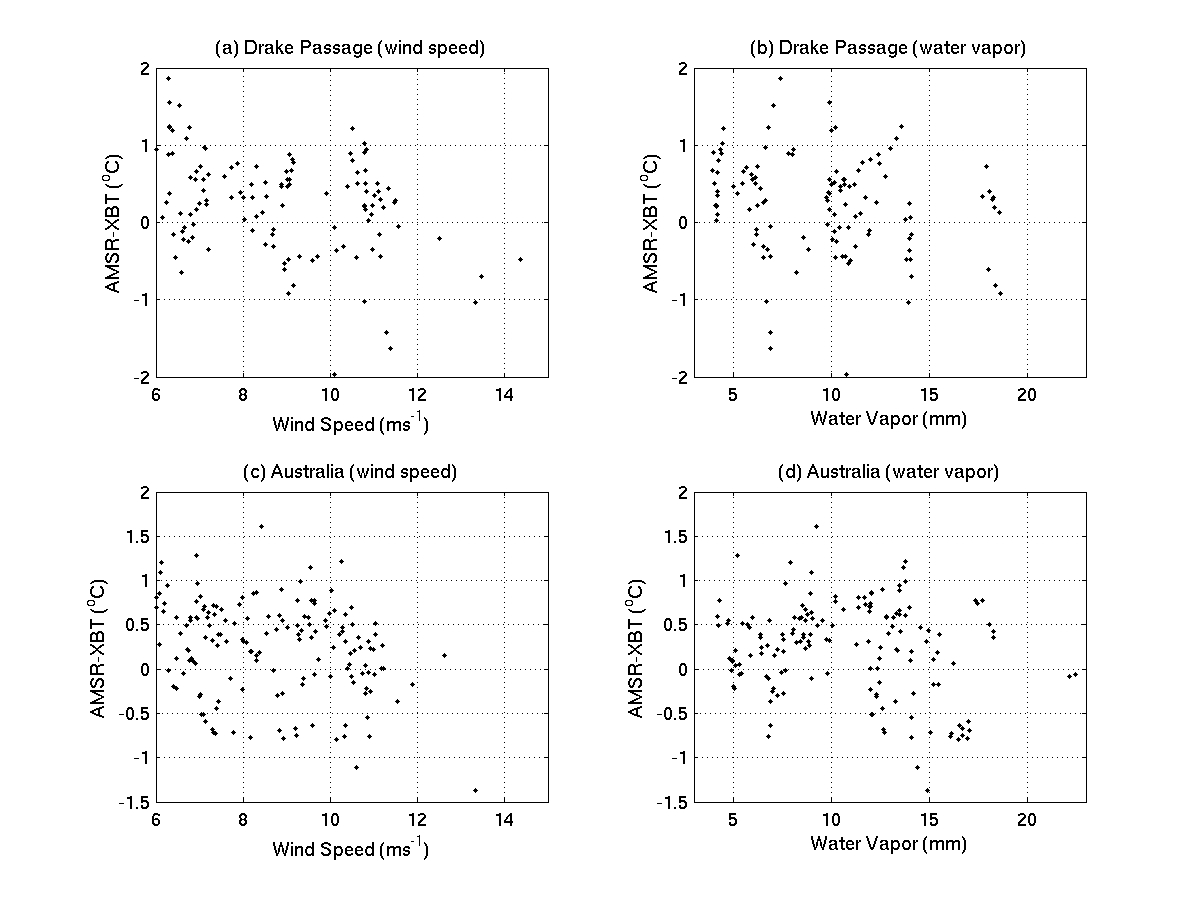
Figure 12
.
Scatter
plots of summertime temperature difference against wind speed (left
panels) and atmospheric water vapor (right panels) for (a) and (b)
Drake Passage transects and (c) and (d) transects between
Hobart and Dumont d'Urville. Data with wind speeds less than 6 ms-1
and differences between the measurement time of AMSR-E and XBT longer
than 5 hours are removed.
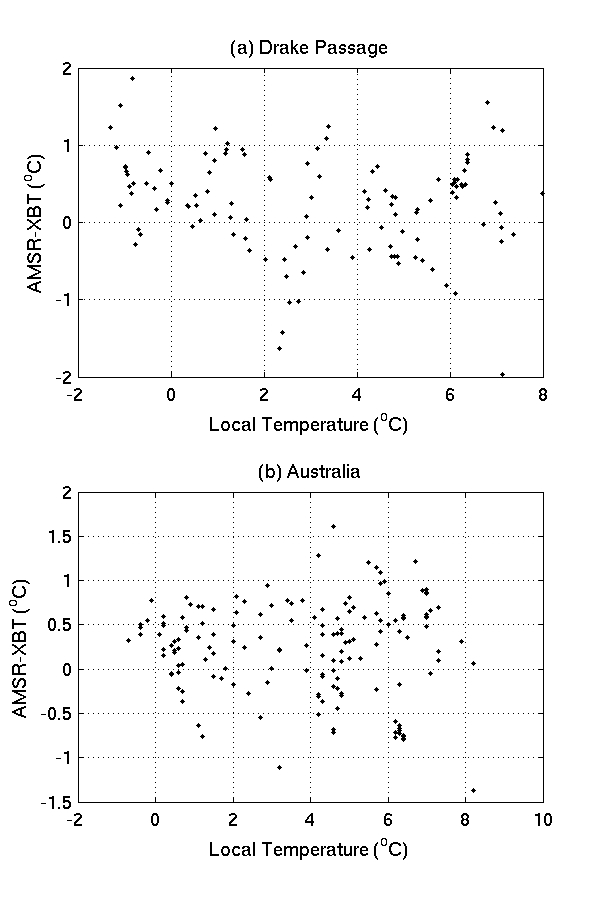
Figure 13
.
Scatter
plots of temperature difference between nighttime AMSR-E and XBT
against local temperature for (a) Drake Passage transects and (b)
transects between
Hobart and Dumont d'Urville.
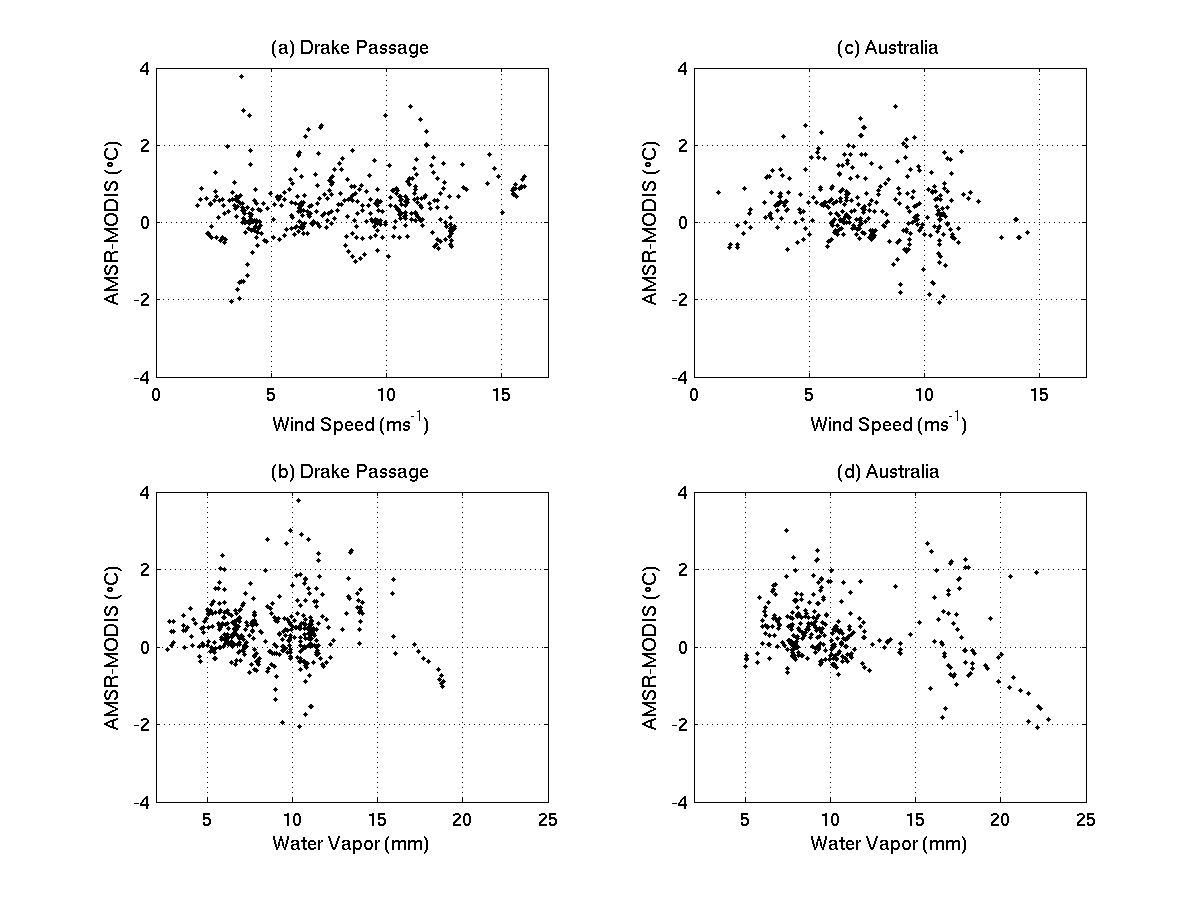
Figure 14
.
Scatter
plots of temperature difference (AMSR-E minus MODIS) against (a) wind
speeds and (b) water vapor for the Drake Passage transects. (c) and
(d) are similar to (a) and (b), but for transects between Hobart
and Dumont d'Urville.
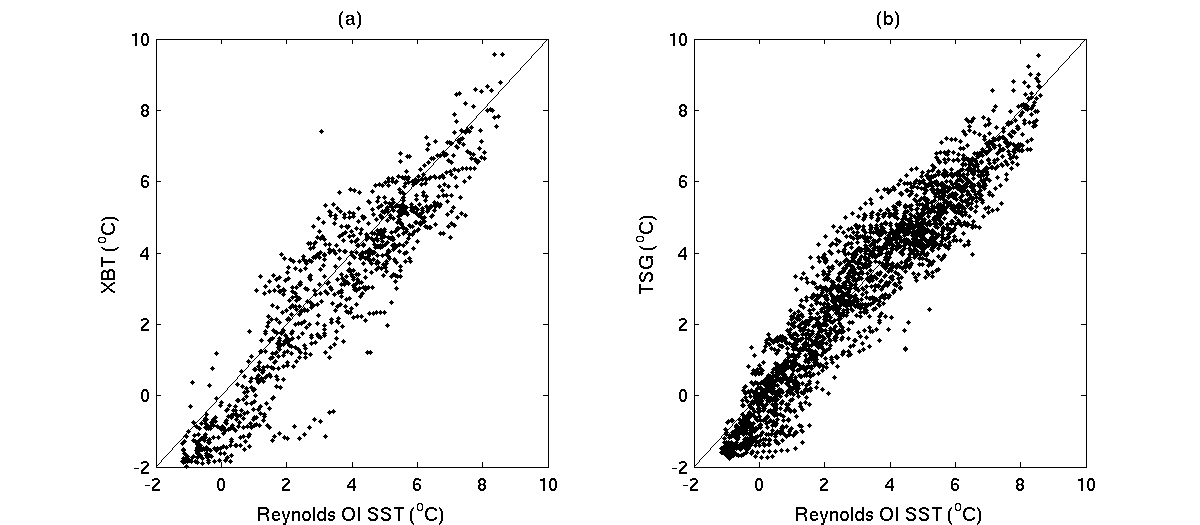
Figure 15
.
Scatter
plots of the (a) Reynolds OI SST against XBT measurements across
Drake Passage and (b)
Reynolds OI SST against TSG measurements.
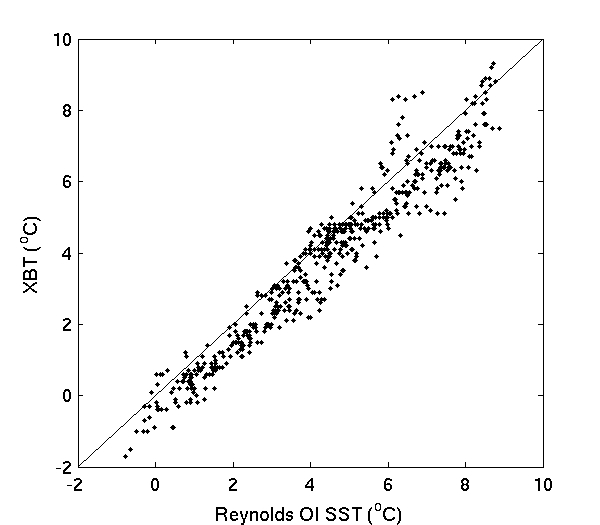
Figure 16
.
Scatter
plots of the Reynolds OI SST against XBT measurements between
Hobart and Dumont d'Urville.
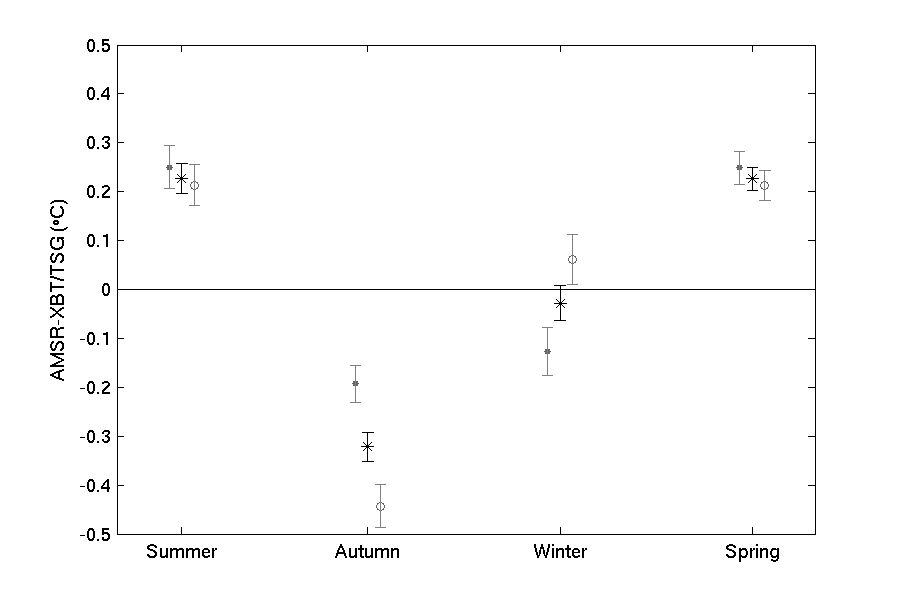
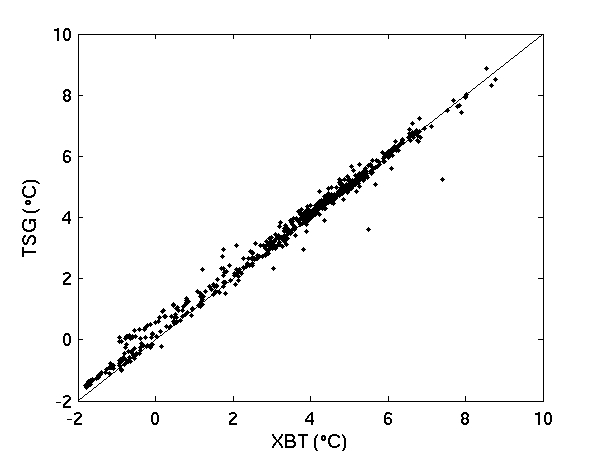
Figure 17
.
Three-month
averaged temperature difference (AMSR minus XBT/TSG) from all data
(stars). Dots and circles are the temperature differences for daytime
and nighttime ∆SST
separately. The
corresponding standard error is indicated by the vertical lines.
Figure 18
.
Scatter
plots of the XBT SST and TSG SST at Drake Passage.
Figure 19
Mean SST difference (June 2002 - December 2004) between AMSR and MODIS
(from Aqua), and wind speed, water vapor, and cloud in regions of Drake Passage (left column) and south of Australia (right column).
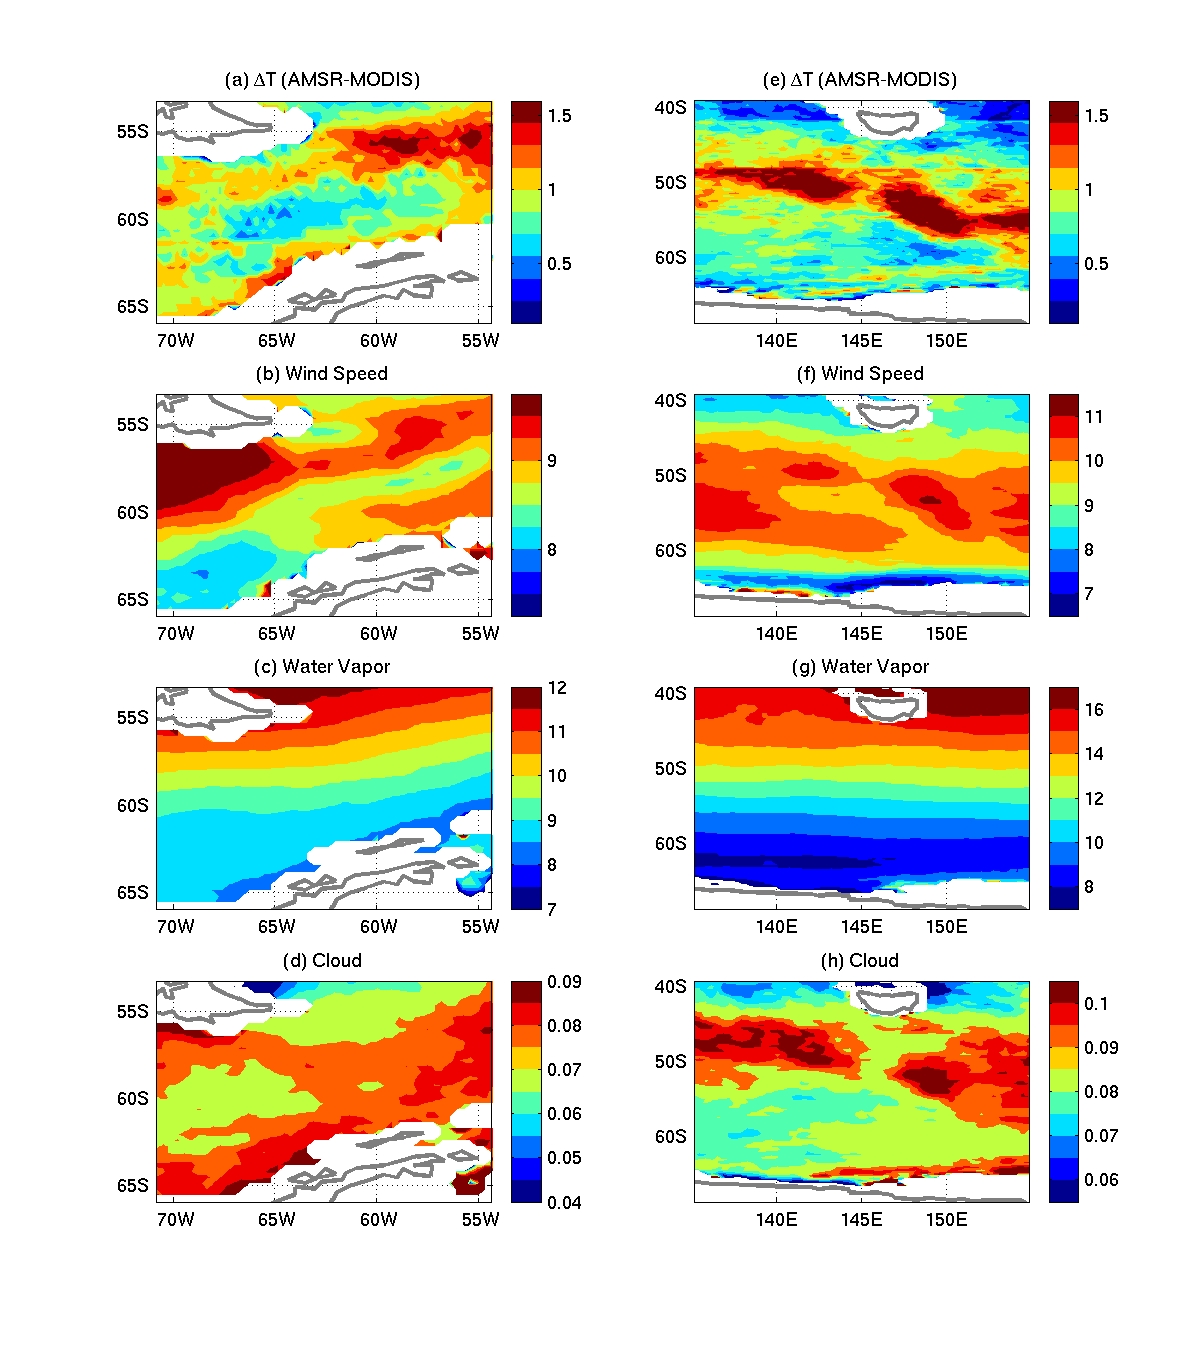
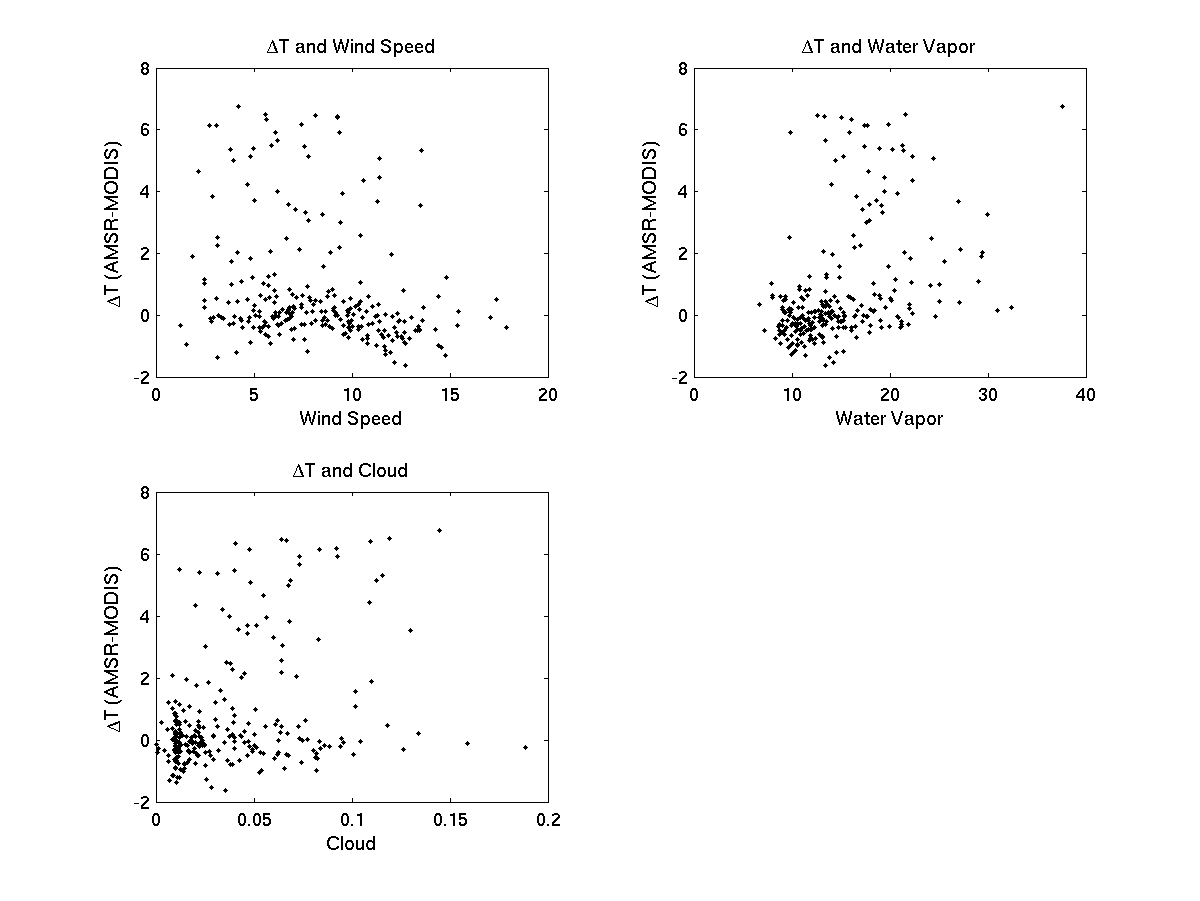
Figure 20
Example of the changes of delT (AMSRE minus MODIS) with changes of wind
speed, water vapor and cloud at one location.