
Lynne Talley (ltalley@ucsd.edu) 11/09/00, with some phone comments from K. Speer
incorporated
Please feel free to adapt, adopt, modify, etc
Figures included here are from our own publications since they were
easily available to me.
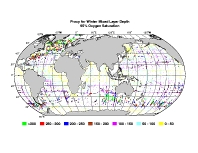
Subduction into the southern hemisphere subtropical gyres is dominated volumetrically by Subantarctic Mode Water and the densest of the SAMW's, Antarctic Intermediate Water (AAIW). SAMW refers to the thick mixed layers found directly north of the Subantarctic Front. A map of a proxy of winter time mixed layer depth ( Fig. 1 from Talley, 1999) shows that these layers are thickest in the eastern Indian Ocean and all across the Pacific. The sudden onset of thicker layers in the central Indian Ocean is an important mystery to be solved.
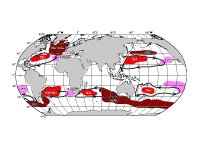
SEISAMW. In the Indian Ocean, the densest subducting water is also the thickest layer, and is formed in the southeastern Indian Ocean, south of Australia. It is often referred to as Southeast Indian SAMW or SEISAMW. It is the dominant mode of ventilation for the Indian Ocean, leading to a subsurface oxygen maximum.layer that extends northward, even into the tropical and northern Indian Ocean. The spread of this SEISAMW is illustrated by a map of potential vorticity at its core density ( Fig. 2, from McCarthy and Talley, 1999).
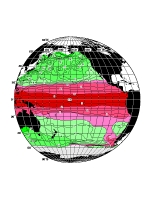
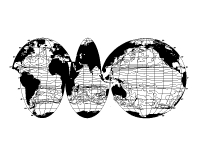
AAIW. In the Pacific Ocean, the densest subducting layer is also the densest of the global SAMWs, and is identical there to AAIW. AAIW is formed in the southeastern Pacific, just west of southern Chile, from where it spreads to the entire southern hemisphere and tropics throughout the globe (schematic in Fig. 3, from Talley, 1999). AAIW in the Pacific has a low potential vorticity signature ( Fig. 4, Talley unpublished manuscript), like SEISAMW in the Indian Ocean. The Pacific AAIW salinity minimum originates from this single source region, through northward subduction. The AAIW found in the Atlantic and Indian originates primarily from this source as well, as a portion of the new AAIW flows eastward through Drake Passage, north of the Subantarctic Front. Some modification of the AAIW takes place during this passage and then it spreads into the South Atlantic's subtropical gyre through eddy shedding and mixing out of the Falkland (Malvinas) loop. (This is not a wind-driven subduction process.) Based on oxygen, potential vorticity and salinity in the Atlantic and Indian Oceans, there is no source of AAIW in these oceans other than the southwestern Atlantic. Hence the primary site to study for AAIW formation is the southeastern Pacific, and the primary sites to study for AAIW spreading are Drake Passage and a subtropical section such as the quarterly XBT line at 30S in the Pacific.
 |
 |
Figure 4. Potential vorticity at sigma_1 = 31.7 (core of the Pacific AAIW) for (left) Pacific Ocean (Talley, unpublished) and (right) globe (Talley, 1996). |
Climate impact. Why are these dense and volumetrically large subducting water masses important for climate? They form a large fraction of the subducted water of the subtropical gyres. They spread northward and cross the subtropical/tropical potential vorticity barrier and are found in a weaker form in the tropics. Variations in Southern Ocean surface properties are therefore communicated throughout the subtropical southern hemisphere and into the tropics through these water masses. In the Atlantic, AAIW is a marked part of the warm layer that moves northward, feeding the North Atlantic thermohaline overturning. The freshwater balance is considered to be of importance for long-term climate change (e.g. NADW formation), and AAIW is an important part of the Atlantic's freshwater balance. Thus changes in surface temperature and salinity that might, for instance, be due to the Circumpolar Wave or a stationary Antarctic dipole, or due to longer term changes in Southern Ocean conditions, would be communicated to low latitudes through these water masses.
Formation mechanisms. For several decades there have been two separate ideas about SAMW and AAIW formation. (a) The older concept was that AAIW is formed circumpolarly, through Ekman transport northward across the Subantarctic Front and then sliding northward down isopycnal surfaces.
(b) The newer concept (still dating to the 1970s, McCartney, 1976) is that SAMW is formed north of the Subantarctic Front through subtropical gyre processes and that AAIW is the densest of the SAMWs, and hence localized in its formation area. (SEISAMW has been recently recognized as a similarly important water mass with respect to its ventilation of the Indian Ocean. )
Both mechanisms are likely active. The northward Ekman transport across the SAF occurs into the local SAMW layer and may be important for creating the great thickness of the SAMW layer. WOCE hydrographic sections show intrusions across the SAF into the SAMW. Eastward transport of the SAMWs then eventually leads to both new SEISAMW, subducting into the Indian Ocean, and new AAIW, partiially subducting into the Pacific Ocean and partially passing on to the Atlantic/Indian subtropical gyre. The second source of water for the SAMW and AAIW is subtropical circulation poleward in the western boundary currents, in the traditional model of subtropical subduction.
Proposed observational program.A complete study of SAMW and AAIW formation, subduction and variability should include at least the following:
A strawman observational plan might thus include:
For postscript versions of the plots:
Click these with the right mouse button.
Figure 1 (left) postscript (Oxygen saturation map)
Figure 1 (right) postscript (Mode water schematic)
Figure 2 (left) postscript (Indian PV at 26.88 gamma - SEISAMW)
Figure 2 (right) postscript (Indian PV at 27.35 gamma - AAIW)
Figure 3 postscript (AAIW schematic - you might have trouble printing
this postscript - gif file from above recommended)
Figure 4 (left) postscript (Pacific PV at 31.70 sigma 1 - AAIW)
Figure 4 (right) postscript (global PV at 31.70 sigma 1 - AAIW)
Additional potential vorticity map Pacific at 26.80 sigma theta (for Kevin
Speer)
Pacific 26.80 sigma theta potential vorticity - gif file - click here to
view
Sources for figures
Hanawa, K. and L. D. Talley, 2000. Mode Waters. Ocean Circulation and Climate, G. Siedler and J. Church, editors, International Geophysics Series, Academic Press, in press.
McCarthy, M. C. and L. D. Talley, 1999. Three-dimensional potential vorticity structure in the Indian Ocean. J. Geophys. Res., 104, 13251-13267.
Talley, L.D., 1996. Antarctic Intermediate Water in the South Atlantic. The South Atlantic: Present and Past Circulation, ed. G. Wefer, W.H. Berger, G. Siedler and D. Webb, Springer-Verlag, 219-238.
Talley, L. D., 1999. Some aspects of ocean heat transport by the shallow, intermediate and deep overturning circulations. In Mechanisms of Global Climate Change at Millenial Time Scales, Geophys. Mono. Ser., 112, American Geophysical Union, ed. Clark, Webb and Keigwin, 1-22.